Pool Pump Flow Rate vs Head: How to Read a Pump Curve
Pool pump flow rate vs head explained with certified test data: why more resistance means less flow, how to read a pump curve, and converting psi to feet.
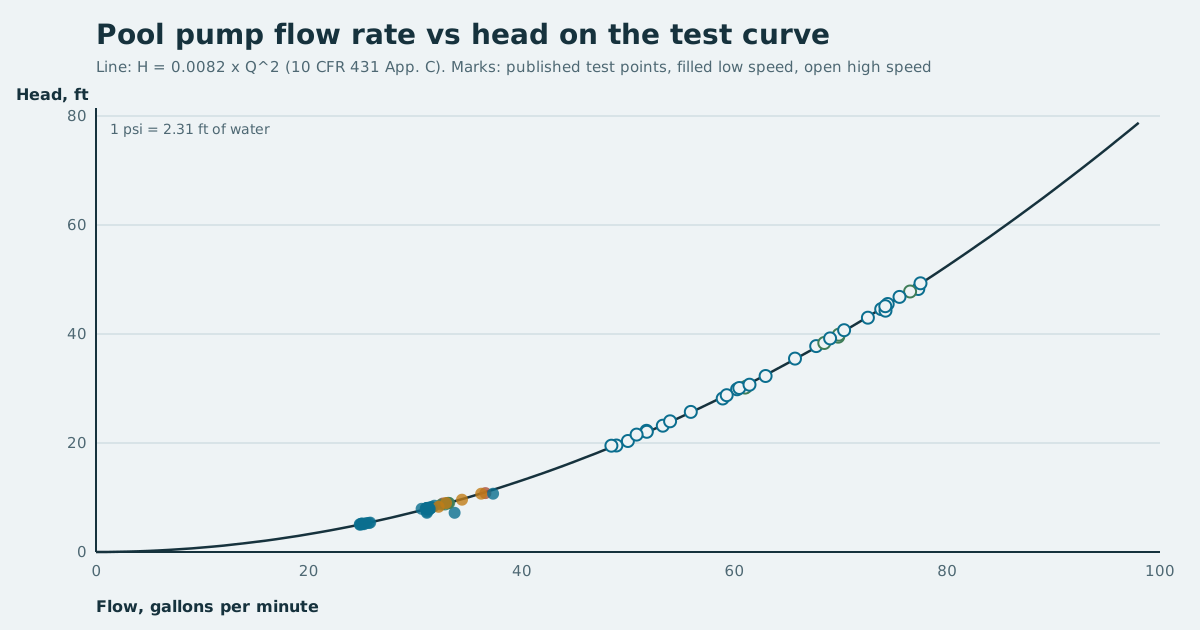
Pool pump flow rate vs head is a trade: at any given speed, the harder the plumbing resists, the less water the pump moves. Head is that resistance expressed as feet of water, and a pump curve is simply a graph of the flow a pump delivers at each head. Where that curve crosses your plumbing's own resistance curve is the flow you actually get.
Every ENERGY STAR certified pool pump record publishes flow and head together at its test points, measured against one standard resistance curve set by federal law. That makes the certified list an unusually clean set of examples. This guide uses them to explain head, the two curves that decide your flow, and how to read a manufacturer's pump curve for your own pool.
What head means on a pool pump
Head is a way of measuring pressure as a height. A pump that develops 10 feet of head could, in principle, push water 10 feet up a vertical pipe. In a pool system almost none of that is real height; it is the friction of water moving through pipe, elbows, valves, the filter, a heater and the return fittings.
The DOE Building America guide on pool pump retrofits calls the total of that resistance the total dynamic head (TDH). It says small-diameter pipes, hard 90-degree turns, certain filtration devices and high flow rates all increase TDH, and that removing resistance from the plumbing improves the system's efficiency.
Pressure gauges on pool filters read in pounds per square inch, not feet. The conversion is fixed: 1 psi = 2.31 feet of head of water. A filter gauge reading of 15 psi corresponds to about 35 feet of head at that point in the system.
Pool pump flow rate vs head: the two curves
Two curves decide the flow you get.
The pump curve. For a pump at one speed, flow falls as head rises. Run the pump against no resistance and it moves its maximum flow; close a valve completely and flow falls to zero while head climbs to its maximum. Manufacturers publish this curve for each pump, and for a variable speed pump, one curve per speed.
The system curve. Your plumbing has its own curve, and it rises with flow. Friction grows roughly with the square of flow, so doubling the flow through the same pipes roughly quadruples the head.
The pump runs where the two curves cross. Change either one and the operating point moves. Turn the pump up and its curve moves up and out, giving more flow at more head. Add resistance, from a dirty filter or a closed valve, and the system curve steepens, giving less flow at more head.
The federal test curve and the certified points
The federal test procedure, in Appendix C to Subpart Y of 10 CFR Part 431, does not test pumps in real pools. It sets a standard system curve and measures every pump against it. For filter pumps the measurement points use this curve:
H = 0.0082 × Q², with H in feet and Q in gallons per minute.
That is the parabola on the figure at the top of this page. The dots are the published low-speed and high-speed test points from the certified records held in full detail on this site, 84 distinct points in all. Nearly every one sits on the line: the median gap between the published head and the equation is about a tenth of a foot.
Some values along the curve:
| Flow (gpm) | Head on the test curve (ft) | Same head in psi | Where it appears |
|---|---|---|---|
| 24.7 | 5.0 | 2.2 | Minimum low-speed test flow, pumps of 0.75 hhp or less |
| 31.1 | 7.9 | 3.4 | Minimum low-speed test flow, pumps above 0.75 hhp |
| 50 | 20.5 | 8.9 | High-speed point of a small pump |
| 62.9 | 32.5 | 14.1 | Median high-speed test flow, certified in-ground designs |
| 77.5 | 49.2 | 21.3 | Highest high-speed test flow on the in-ground list |
The test sets the low-speed flow at no less than 24.7 gpm for pumps of 0.75 hydraulic horsepower or less and 31.1 gpm above that, and the high-speed flow at no less than 80% of the pump's maximum flow on reference curve C. That is why the low-speed points bunch at two places on the curve and the high-speed points spread out by pump size.
Hydraulic horsepower is flow times head
Flow and head together give the power delivered to the water. The federal procedure writes it as:
Hydraulic horsepower = flow (gpm) × head (ft) × specific gravity ÷ 3,960, with the specific gravity of water taken as 1.00.
A pump's rated hydraulic horsepower is that figure at maximum speed on reference curve C. The certified records let you check it. The Pentair INTELLIFLO 1.5 VSF publishes a curve C flow of 75.56 gpm at maximum speed; on H = 0.0082 × Q² that is 46.8 feet, and 75.56 × 46.8 ÷ 3,960 is 0.893, against a rated 0.896 hhp. For every one of the 18 distinct detail-set designs that publish a curve C flow, the same arithmetic lands within 1.2% of the rated figure.
That gives a useful reading of hhp: it tells you how far up the standard test curve a pump can push at full speed. The size difference between hydraulic horsepower and the motor rating on the box is covered in pool pump hydraulic horsepower vs total horsepower.
How resistance changes watts and flow: curves A, B and C
The test procedure defines three reference system curves, labelled A, B and C, standing for three different plumbing resistances. Many certified records publish the flow and input power at maximum speed on each one. That shows directly what a more restrictive system does to the same pump at the same speed.
| Pump (certified record) | Curve | Flow at max speed | Watts at max speed | Gallons per watt-hour |
|---|---|---|---|---|
| Pentair INTELLIFLO 1.5 VSF | C | 75.56 gpm | 1,240.73 | 3.65 |
| A | 57.13 gpm | 1,193.02 | 2.87 | |
| B | 34.65 gpm | 1,030.96 | 2.02 | |
| Jandy VS FloPro | C | 69.75 gpm | 1,035.11 | 4.04 |
| A | 53.84 gpm | 978.72 | 3.30 | |
| B | 33.59 gpm | 853.00 | 2.36 | |
| Pentair IntelliFlo VS | C | 96.89 gpm | 2,502.49 | 2.32 |
| A | 71.08 gpm | 2,157.80 | 1.98 | |
| B | 41.80 gpm | 1,710.55 | 1.47 |
The record does not publish head on curves A and B, only flow and power, so the ranking of resistance is inferred from the flows: the same pump at the same speed moves the most water on C and the least on B. On B each of these pumps moved less than half its curve C flow while still drawing between 68% and 83% of the power. Water moved per unit of electricity fell by 37% to 45%.
That is the clearest case in the data for the DOE guide's point about resistance. A restrictive system does not just cut flow. It makes every gallon more expensive.
How to read a pool pump curve
A manufacturer's pump curve chart has flow in gpm along the bottom and head in feet up the side. Each line is one speed, or for an older pump one impeller size.
- Find your head. Read the pressure at the filter while the pump runs at the speed you want to check. Convert psi to feet by multiplying by 2.31. This is an approximation of the head the pump sees, because suction-side resistance is not captured by a filter gauge, and it usually understates TDH somewhat.
- Find your speed's line. On a variable speed pump chart there is a line per rpm setting; pick the one you run.
- Read across and down. From your head on the vertical axis, move across to the speed line, then down to the flow axis. That flow is your estimate.
- Check the efficiency zone. Many charts shade the region where the pump runs most efficiently. An operating point far to the right, at high flow and low head, or far to the left, near shut-off, usually means the pump is mismatched to the plumbing.
A worked example: a gauge reads 12 psi at the speed used for filtration, which is about 27.7 feet of head. On the federal test curve, 27.7 feet corresponds to about 58 gpm. If your system were exactly the test curve, that is the flow you would expect. If your plumbing is more restrictive, the same pump at the same pressure is likely moving less, and only the manufacturer's curve for that speed, or a flow meter, tells you how much.
Why the filter gauge creeps up
As a filter loads with dirt, it adds resistance. The system curve steepens, the operating point slides up the pump curve, head rises and flow falls. The gauge reading going up is the visible sign of that; noting the clean-filter reading gives you a baseline to compare against.
For turnover, falling flow is what matters. The hours that gave one full turnover with a clean filter may give noticeably less as it loads. The how long to run a pool pump guide covers setting run time with that in mind.
Lowering head lowers your bill
Because pump power depends on both flow and head, a system with less resistance needs less power for the same flow. The DOE guide's practical recommendations are worth listing:
- Bigger pipe and low head-loss filters where you are replumbing or replacing equipment.
- No 90-degree elbow straight into the pump inlet. The guide recommends a straight run at the suction port of at least five pipe diameters, for example 10 inches of straight pipe on 2-inch pipe.
- Remove resistance wherever you can, from unnecessary valves to undersized fittings.
The DOE/NREL fact sheet on pool energy from 2000 adds that increasing pipe diameter, shortening runs and replacing abrupt elbows with 45-degree fittings or flexible pipe are part of the measures that, together with a smaller pump, can cut a pump's electricity use substantially.
None of this needs a new pump. It moves the system curve down, and the pump then delivers more flow at each speed, so it can run slower for the same turnover.
Pump size and head
A larger pump develops more head at full speed, but that is only useful if the system needs it. On narrow plumbing, a big pump at high speed spends much of its extra power on resistance. A variable speed pump sized with some margin, and run at the slowest speed that meets your flow, will usually sit in a better part of its curve. The flow-first approach to choosing a size is in what size pool pump do I need.
What the certified data can and cannot tell you
The certified records show each pump on one standard system curve and, for many, two more. They are a fair basis for comparing pumps. They are not your system. Your head at a given flow depends on your own plumbing, and only a pressure reading with the maker's curve, or a flow meter, tells you where your pump actually runs. Every pump page on this site shows the published points on a flow-versus-power chart; the certified pump list links to all of them.
Sources
- ENERGY STAR Certified Pool Pumps dataset, 423 records retrieved 17 October 2026. All published flows, heads, watts and curve A, B and C values; the grouping into designs is on the methodology page.
- 10 CFR 431, Appendix C to Subpart Y: the test-point head equation H = 0.0082 × Q², the 24.7 and 31.1 gpm low flows, the 0.8 × curve C high flow, the hydraulic output power formula with its 3,960 constant, and the rated hydraulic horsepower definition. Retrieved 17 October 2026.
- DOE Building America, Measure Guideline: Replacing Single-Speed Pool Pumps with Variable Speed Pumps for Energy Savings (Hunt and Easley, 2012): total dynamic head and the plumbing recommendations. Retrieved 17 October 2026.
- DOE/NREL fact sheet, Conserving Energy and Heating Your Swimming Pool with Solar Energy (2000): reducing hydraulic resistance. Retrieved 17 October 2026.
- Math for Trades: Volume 2, Pressure Measurements (BCcampus): 1 psi = 2.31 feet of head. Retrieved 17 October 2026.
Read your pressure, convert it to feet, and find it on the maker's curve for your speed: that is pool pump flow rate vs head in practice, and lowering the head is the cheapest way to get more flow for fewer watts.
Frequently asked questions
What is head on a pool pump?
Head is the resistance the pump pushes against, expressed as the height of a column of water in feet. It comes from pipe friction, fittings, the filter, heater and other equipment. One psi equals 2.31 feet of head.
Does more head mean less flow?
Yes. At a fixed speed, a pump delivers less flow as the head it works against rises. That is what a pump curve shows: flow on one axis, head on the other, with the curve sloping down.
What is a typical total dynamic head for a residential pool?
There is no single figure; it depends on pipe size, run length, fittings and equipment. The federal test uses a standard curve, H = 0.0082 x Q squared, which puts 31.1 gpm at about 7.9 feet and 77.5 gpm at about 49 feet. Your system may sit above or below that.
How do I find my pool pump's flow rate?
A flow meter on the return line is the direct way, and many variable speed pumps display an estimate. Otherwise, read the pressure, convert it to head, and find that head on the manufacturer's pump curve for the speed you run; the curve gives the flow.
Why does my pool pump's flow drop when the filter gets dirty?
A loading filter adds resistance, which raises the head the pump works against. Higher head moves the operating point down the pump curve to less flow. Cleaning or backwashing the filter brings the head and flow back.